
Airports and routes in Nevada and Colorado have been named among the worst overall for turbulence in North America in 2025.
They feature in the newly released top 10 turbulence rankings from turbli.com, which monitors and predicts turbulence using the same sources pilots and airlines use to plan their flights: the National Oceanic and Atmospheric Administration (NOAA) and the Met Office.
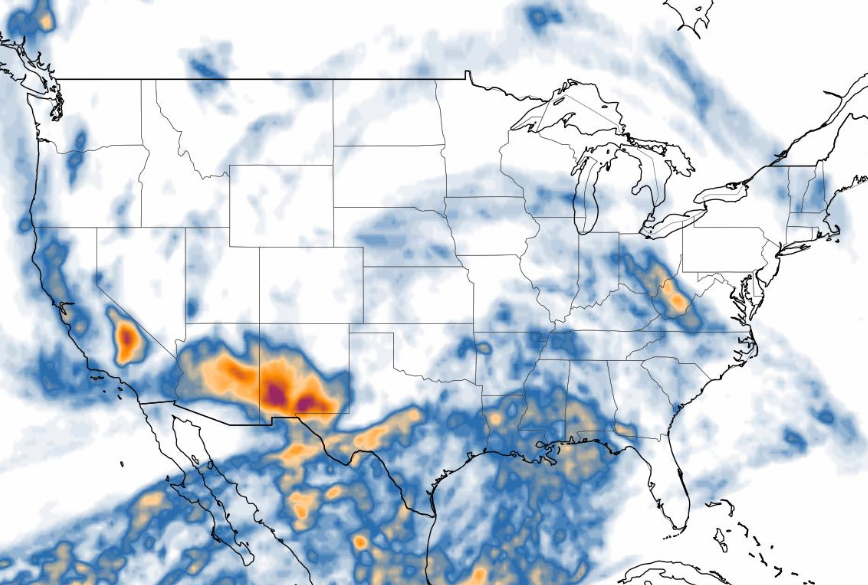
Turbli.com unveiled a top 10 ‘most turbulent airports’ list for approaches and descents — take-offs and landings are affected by crosswinds, not turbulence — that is topped by Denver, Colorado, with Bozeman Yellowstone International Airport in Montana placed second.
They both have average annual EDR scores (“eddy dissipation rates”) of 17, a unit that describes how fast turbulence disappears.
The website describes EDR values of 0 to 20 as “light — smooth flight conditions”; 20 to 40 as “moderate”, leading to “difficulty with walking and food services”; 40 to 60 as “strong”, with passengers straining against seat belts; 60 to 80 as “severe”, with “violent and sudden changes in altitude; and 80 to 100 as “extreme”, meaning the “aircraft is practically impossible to control.”
The rest of the top five most turbulent airports list comprises Albuquerque, New Mexico (No. 3), Salt Lake City, Utah (No. 4), and Jackson, Wyoming (No. 5).
The table is rounded out by Vancouver (No. 6), Las Vegas (No. 7), Seattle (No. 8), Reno (No. 9), and Boise, Idaho (No. 10).
Turbli.com also published a top 10 list of flight routes, with Denver—Jackson ranked No.1, thanks to an EDR rate of 18. It’s followed by Albuquerque — Denver (No.2); Jackson — Salt Lake City (No.3); Denver — Salt Lake City (No.4); Bozeman — Denver (17.22).
Globally, the most turbulent airport was Santiago, Chile (21 EDR), with the rockiest route from Mendoza, Argentina, to Santiago (22 EDR).
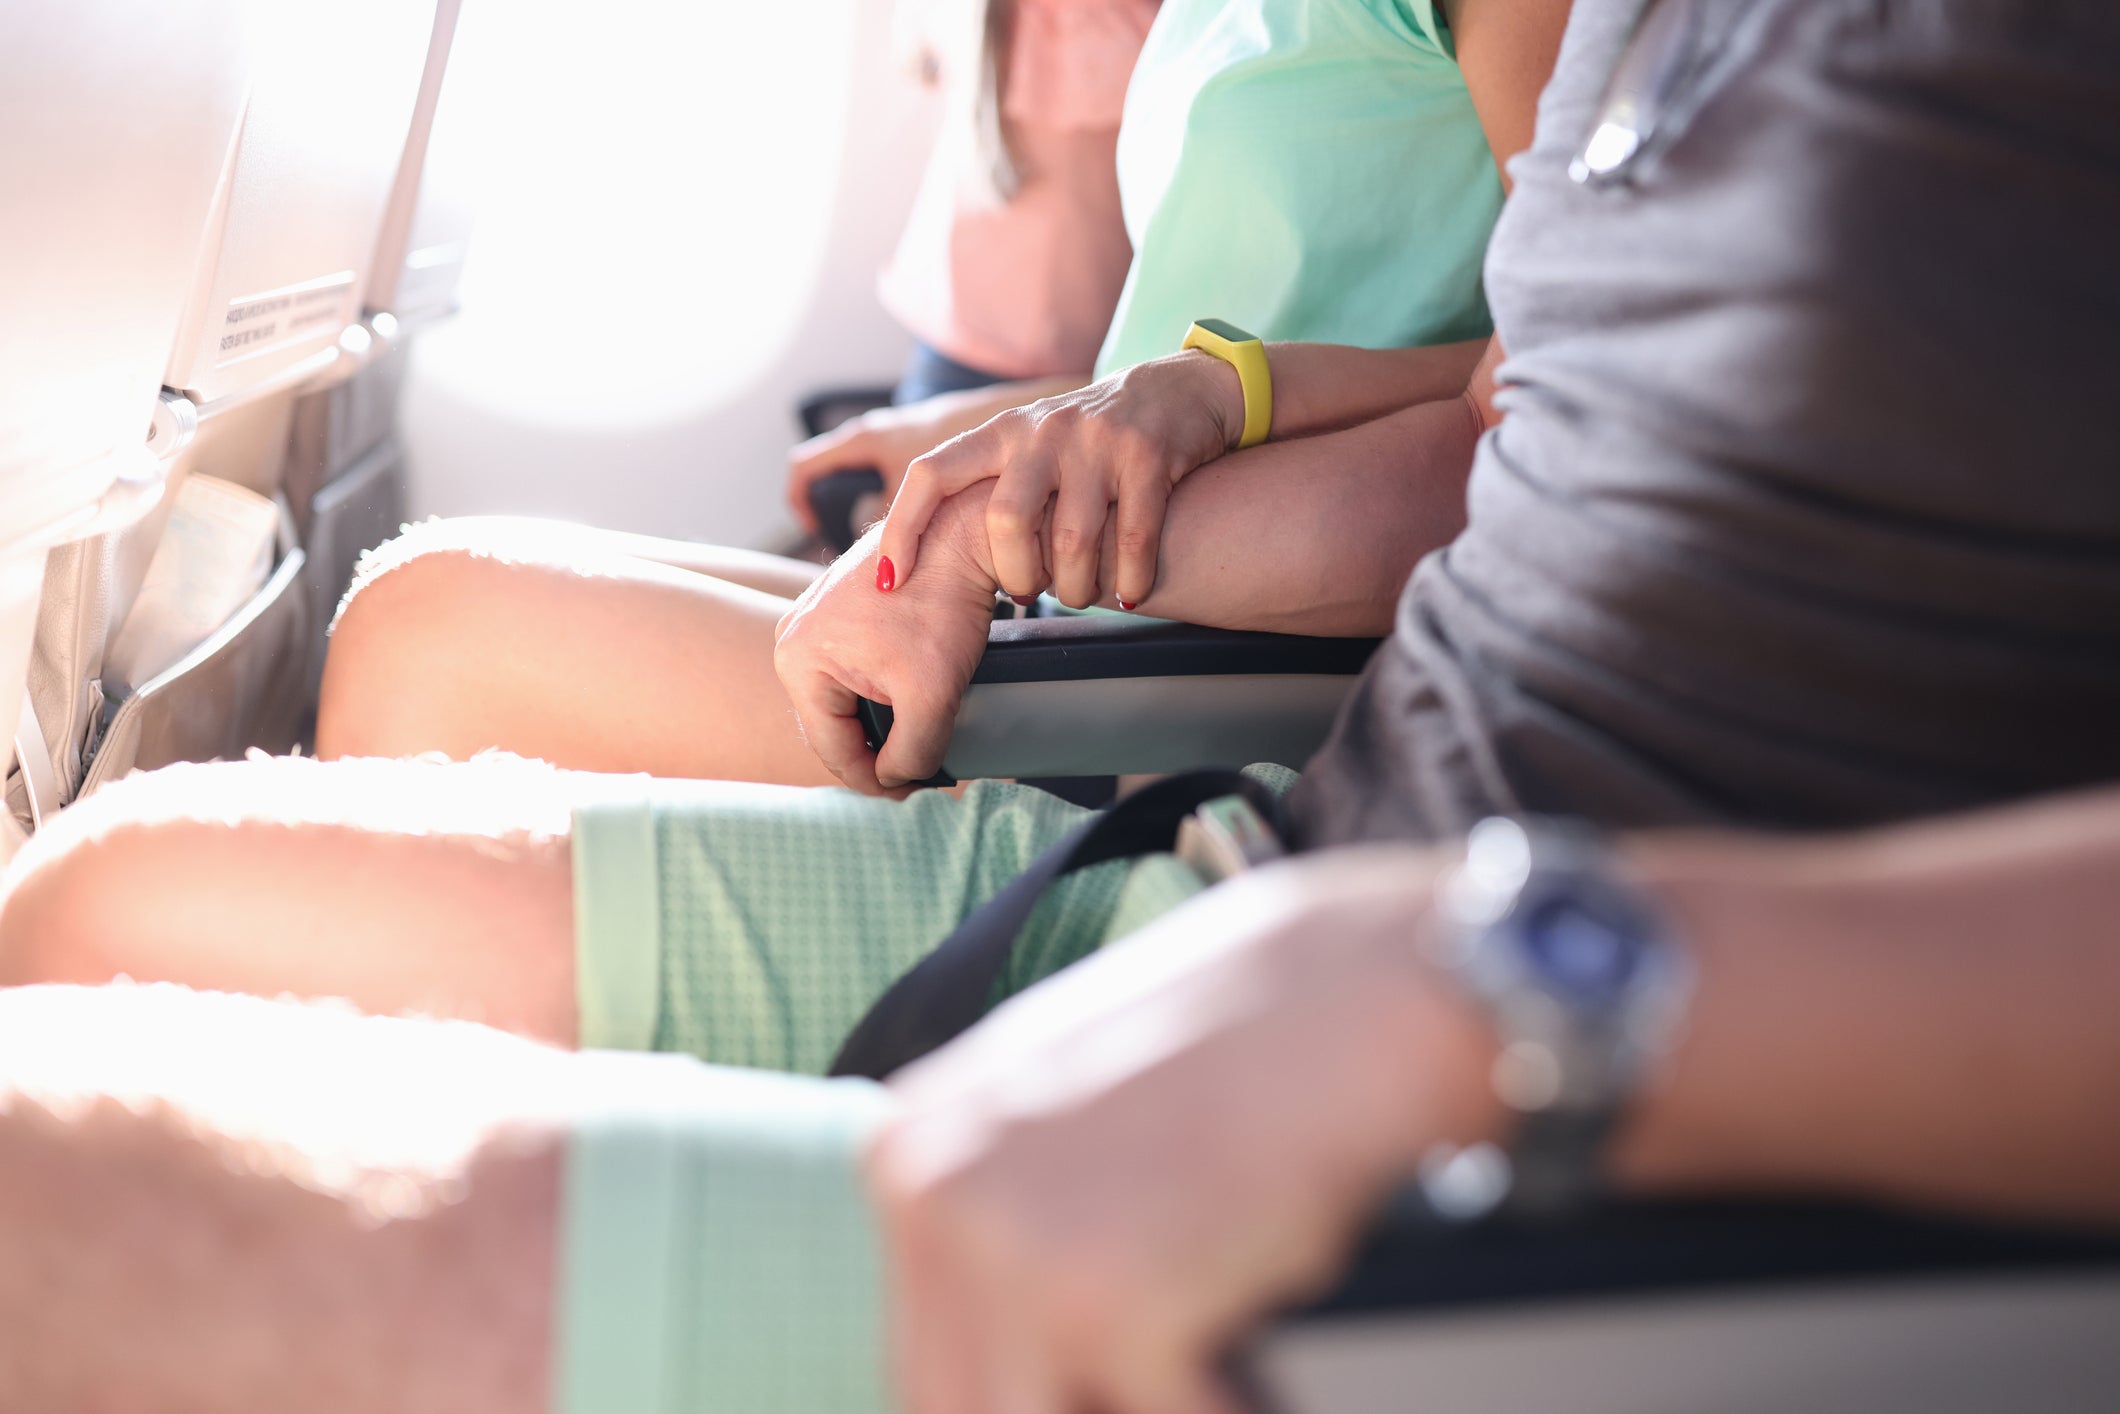
Turbulence, undoubtedly the scariest aspect of a flight for nervous fliers, is caused by warm air rising through cooler air; mountains or manmade structures disrupting air flow, and pockets of air moving in different directions.
It’s completely normal, and modern aircraft are designed to withstand more turbulence than you’ll ever experience on a flight.
According to data from the Federal Aviation Administration (FAA), there were only 184 serious turbulence injuries between 2009 and 2023, with 37 to passengers and the rest to crew members.
Nervous fliers keen to know what to expect during their flight can enter their upcoming departure and arrival airports and flight numbers into turbli.com’s forecasting tool to view hour-by-hour turbulence levels for their trip, presented as a graph.
North America’s 10 most turbulent airports
- Denver (17.91 EDR — eddy dissipation rate)
- Bozeman (17.55)
- Albuquerque (16.62)
- Salt Lake City (16.56)
- Jackson (16.39)
- Vancouver (16.15)
- Las Vegas (15.83)
- Seattle (15.77)
- Reno (15.59)
- Boise (15.47)
North America’s most turbulent routes
- Denver — Jackson (18.18 EDR — eddy dissipation rate)
- Albuquerque — Denver (18.18)
- Jackson — Salt Lake City (17.67)
- Denver — Salt Lake City (17.53)
- Bozeman — Denver (17.22)
- Boise — Bozeman (16.51)
- Bozeman — Salt Lake City (16.48)
- Albuquerque — Salt Lake City (16.17)
- Denver — Las Vegas (16.12)
- Las Vegas — Salt Lake City (16.10)